IC Markets Home Sign in Web Trader Contact Us
IC Markets Social IC Markets Social

Information Hub for
Serious Traders

  • ABOUT US
  • OPEN LIVE ACCOUNT
  • OPEN DEMO ACCOUNT
  • TRADE NOW
  • VISIT OUR BLOG
IC Markets Social
  • ABOUT US
  • OPEN LIVE ACCOUNT
  • OPEN DEMO ACCOUNT
  • TRADE NOW
  • VISIT OUR BLOG
January 18, 2024North_American_Stocks_ptIC Markets

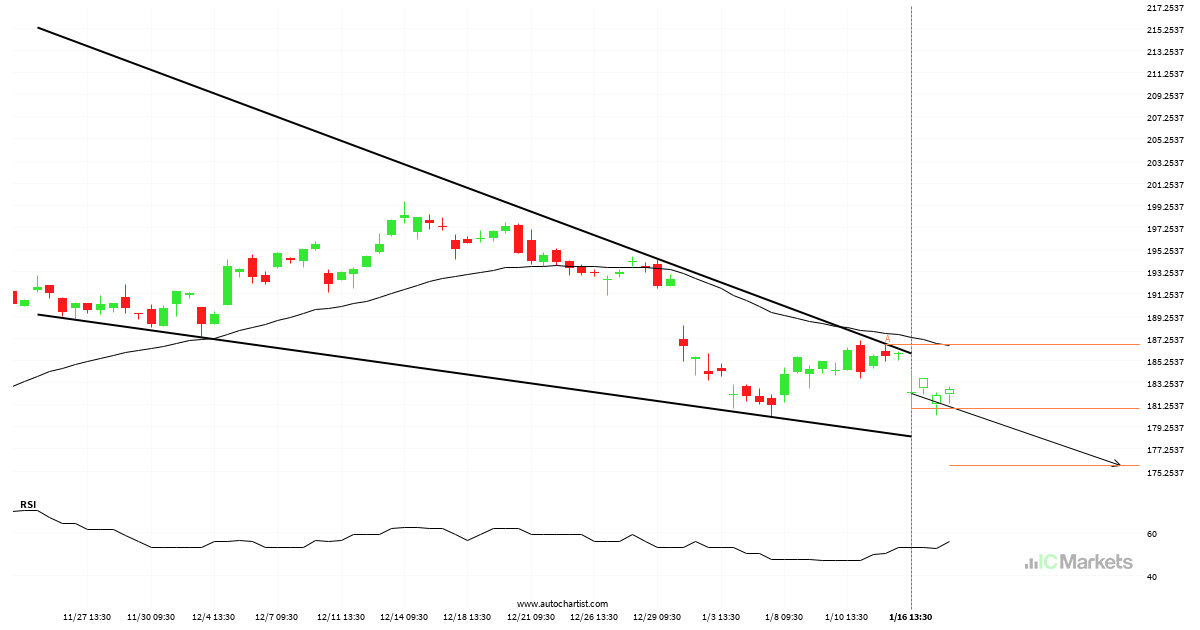
Apple Inc. – Continuation Padrão gráfico – Cunha descendente

Um Cunha descendente emergente foi detectado em Apple Inc. no gráfico 4 hora. Há um possível movimento em direção ao 175.7950 nas próximas velas. Uma vez atingindo resistance, pode continuar sua tendência bearish ou reverter para os níveis atuais de preço.

Read more
January 17, 2024North_American_Stocks_ptIC Markets

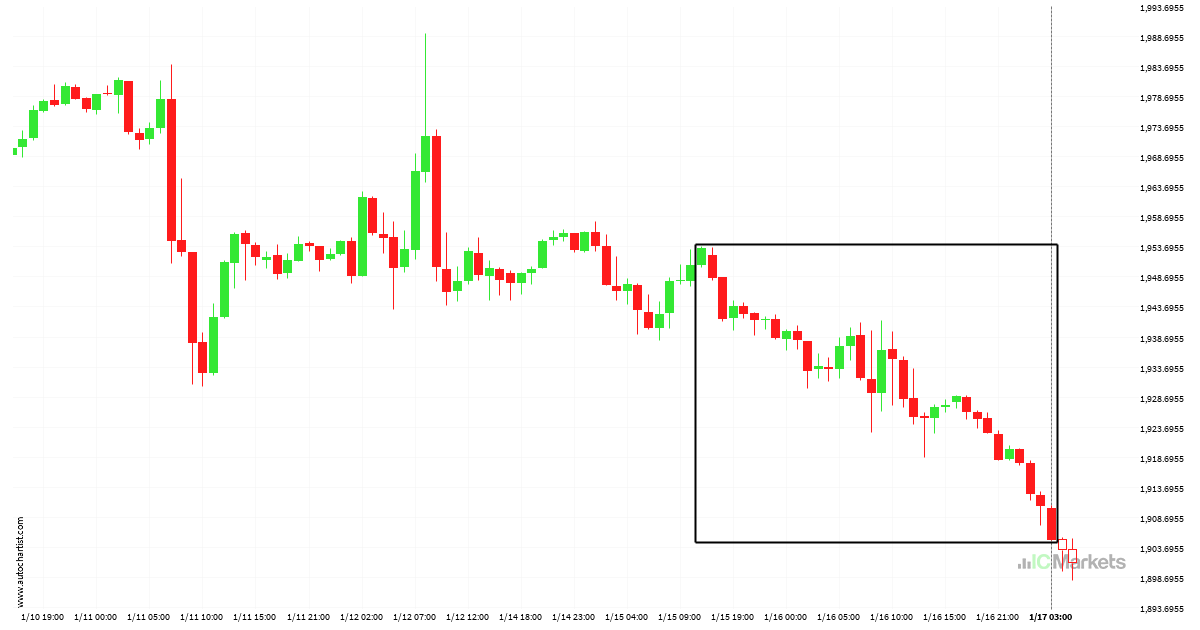
US Small Cap 2000 Index movendo-se downward, não perca.

US Small Cap 2000 Index dropped acentuadamente por 2 dias – o que é um movimento excessivamente grande para este instrumento; excedendo 98% das movimentações de preço passadas. Mesmo que este movimento seja um sinal de uma nova tendência em US Small Cap 2000 Index, há uma chance de que testemunhemos uma correção, por mais […]

Read more
January 16, 2024North_American_Stocks_ptIC Markets

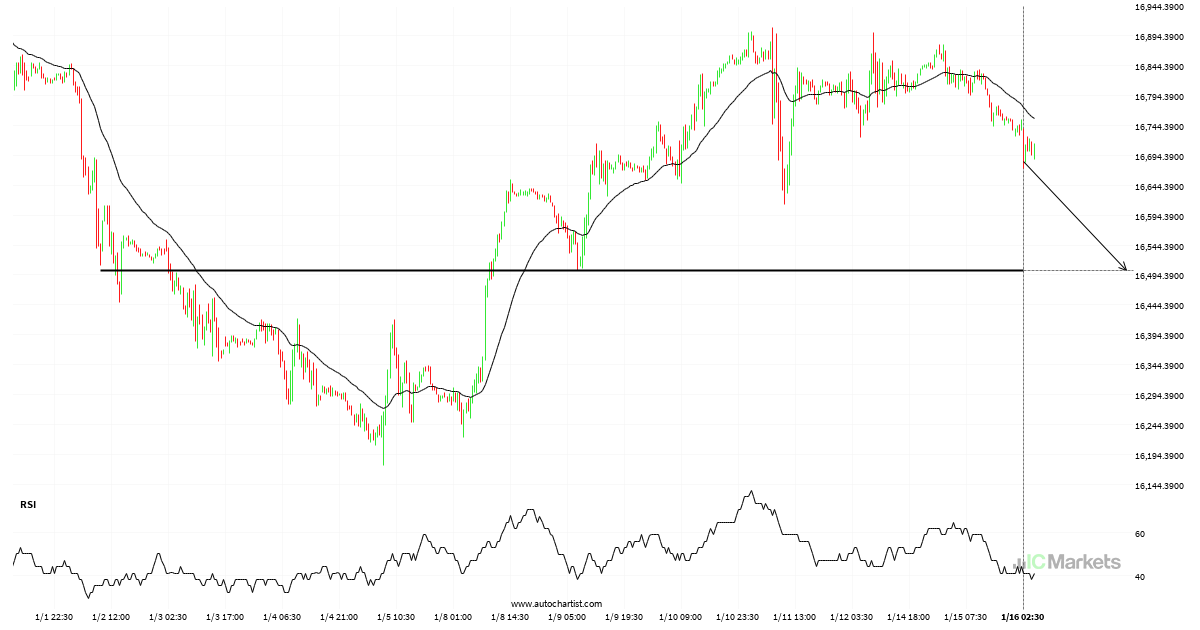
US Tech 100 Index Nível visado: 16502.5000

Aproximando-Apoiar nível de 16502.5000 identificado em 16-jan-2024 02:30 EST

Read more
January 12, 2024North_American_Stocks_ptIC Markets

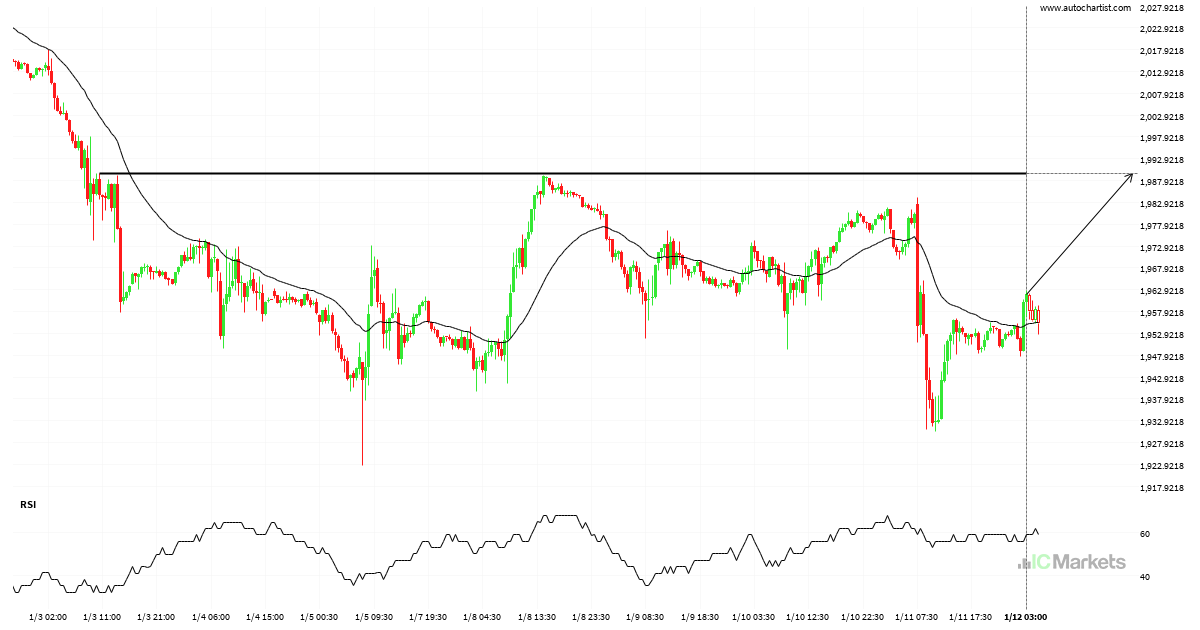
US Small Cap 2000 Index Nível visado: 1989.6500

Aproximando-Resistência nível de 1989.6500 identificado em 12-jan-2024 03:00 EST

Read more
January 11, 2024North_American_Stocks_ptIC Markets

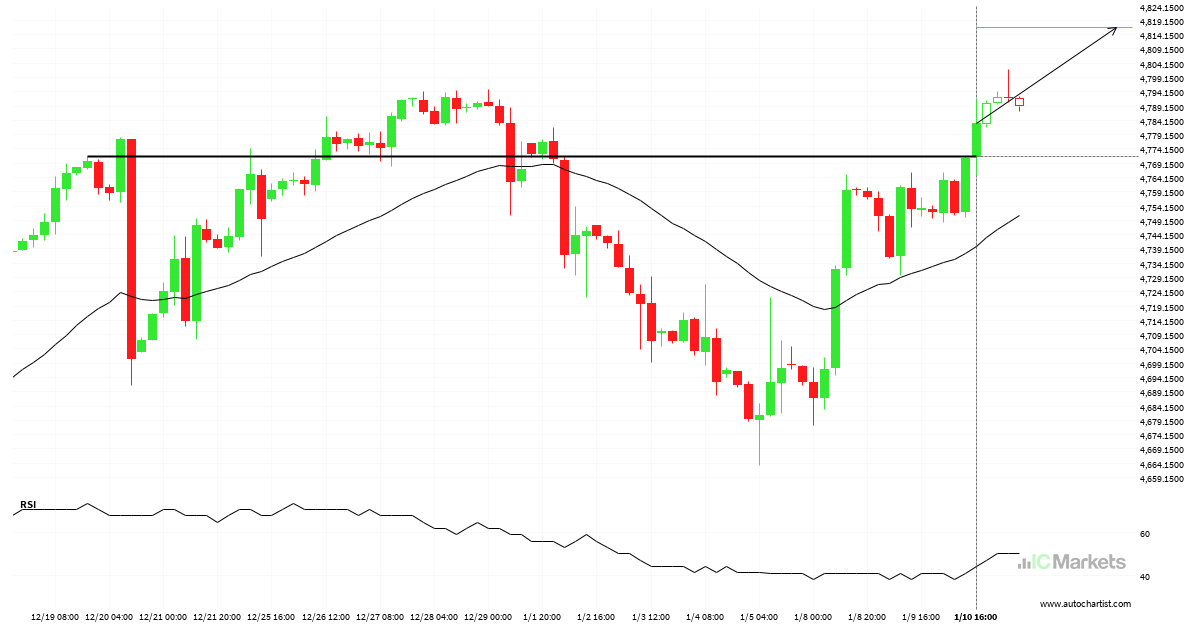
US SPX 500 Index Nível visado: 4816.5000

Rompeu Resistência nível de 4771.5000 em 10-jan-2024 16:00 EST

Read more
January 10, 2024North_American_Stocks_ptIC Markets

US Small Cap 2000 Index Nível visado: 1982.8567

Triângulo quebrou na linha de resistência em 10-jan-2024 04:00 EST. Possível previsão de movimento em alta nos próximos 10 horas para 1982.8567

Read more
January 9, 2024North_American_Stocks_ptIC Markets

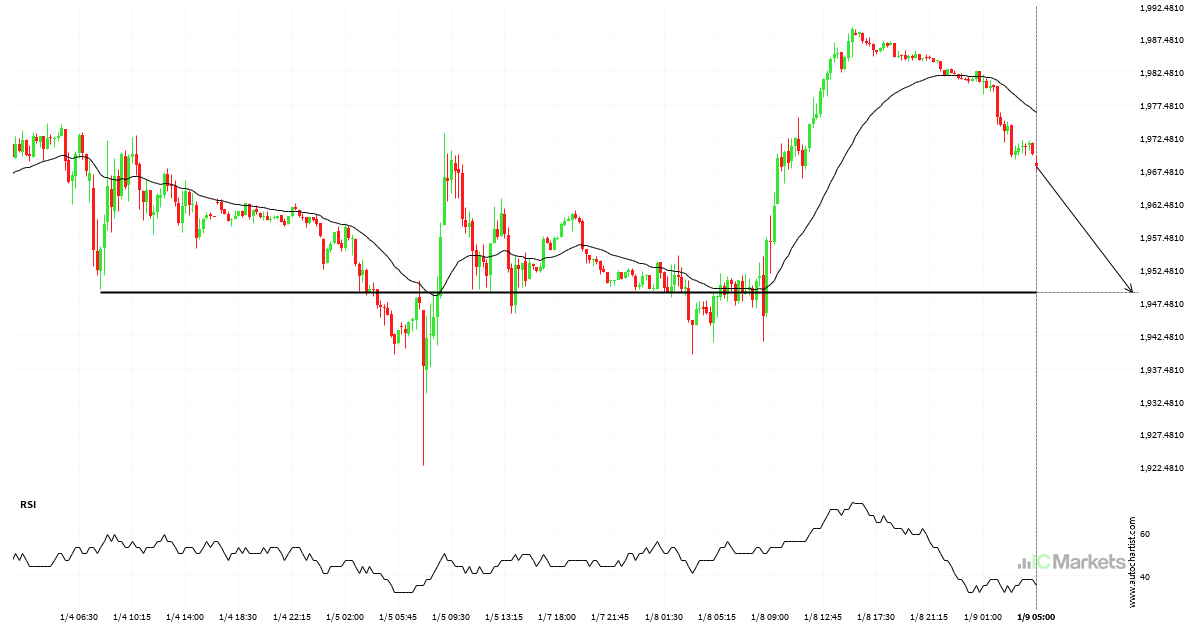
US Small Cap 2000 Index Nível visado: 1948.9800

Aproximando-Apoiar nível de 1948.9800 identificado em 09-jan-2024 05:00 EST

Read more
January 8, 2024North_American_Stocks_ptIC Markets

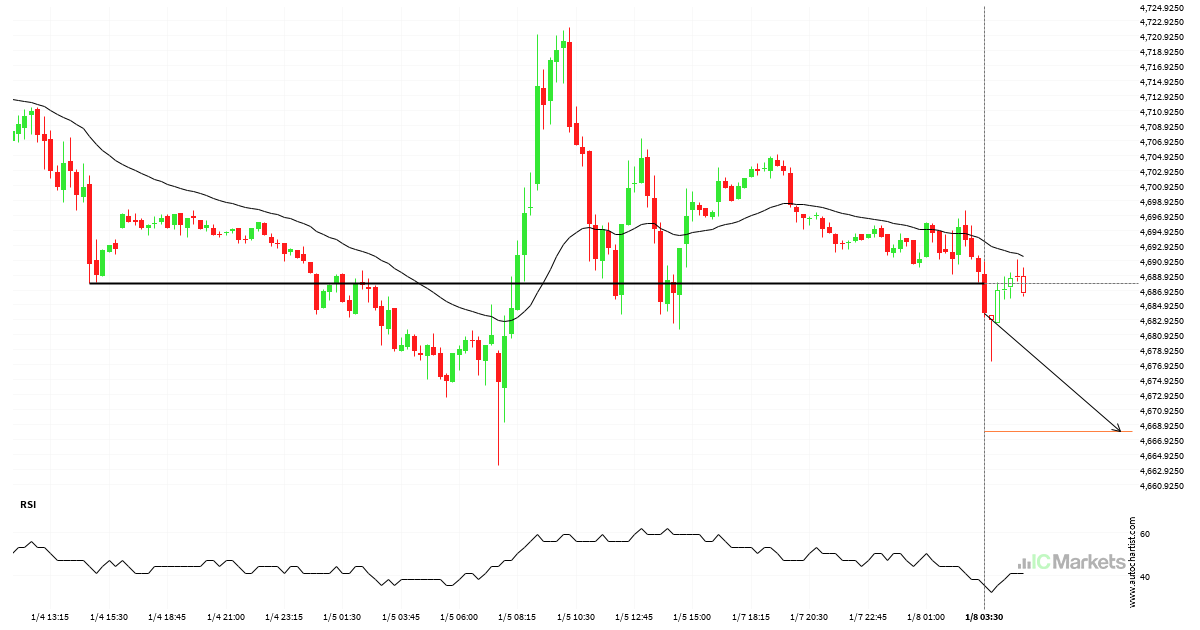
US SPX 500 Index Nível visado: 4668.0498

Rompeu Apoiar nível de 4687.7998 em 08-jan-2024 03:30 EST

Read more
January 5, 2024North_American_Stocks_ptIC Markets

AbbVie Nível visado: 159.9537

Cunha ascendente quebrou na linha de suporte em 04-jan-2024 16:00 EST. Possível previsão de movimento em baixa nos próximos 7 horas para 159.9537

Read more
January 4, 2024North_American_Stocks_ptIC Markets

Oportunidade rara em Unitedhealth Group Inc. – movimento bearish extremo

Unitedhealth Group Inc. dropped acentuadamente por 6 dias – o que é um movimento excessivamente grande para este instrumento; excedendo 98% das movimentações de preço passadas. Mesmo que este movimento seja um sinal de uma nova tendência em Unitedhealth Group Inc., há uma chance de que testemunhemos uma correção, por mais breve que seja.

Read more
  • 1
  • 2
  • 3
  • …
  • 18
  • 19
  • 20
  • 21
  • 22
  • 23
  • 24
  • …
  • 87
  • 88
  • 89

Recent Posts

  • Either a rebound or a breakout imminent on SILVER
  • GOLD Nível visado: 2976.3601
  • A potential bearish movement on GOLD
  • มีโอกาสเกิดการเคลื่อนตัวแบบ bearish บน GOLD
  • Posible gran movimiento en el AUDJPY

Recent Comments

    Translation


     Edit Translation

    Trade with

    a market leader you can rely on

    Open Trading Account Try a Free Demo

    Forex Trading

    • Accounts Overview
    • Open an Account
    • Launch Web Trader

    Trading Specifications

    • Spreads and Commissions
    • Range of Market
    • Trading Hours
    • Funding
    • Withdrawal

    About IC Markets

    • Help Center
    • Why IC Markets
    • Regulation
    • Legal Documents
    • Contact Us


    Forex Trading

    • Accounts Overview
    • Open an Account
    • Launch Web Trader

    Trading Specifications

    • Spreads and Commissions
    • Range of Market
    • Trading Hours
    • Funding
    • Withdrawal

    About IC Markets

    • Chat with a Specialist 24/7
    • Why IC Markets
    • Regulation
    • Legal Documents
    • Contact Us

    Disclaimer: This material is marketing material where all marketing material is published for informational purposes only. This material does not contain and should not be considered as containing - investment advice and recommendations, or suggestions for performing any actions with financial instruments. The built-in widgets belong to their external independent authors, and IC Markets is not responsible for their content and their impact on trade.

    All content rights reserved. Opinions of the authors may not coincide with the opinion of the blog editors. When copying materials from this site or connecting to an RSS feed to republish our articles, a link to IC Markets or attribution in the format ‘IC Markets Blog’ is required. For general questions, please contact the editorial office via the form on the Contact us page.

    Risk Warning: Trading Derivatives carries a high level of risk to your capital and you should only trade with money you can afford to lose. Trading Derivatives may not be suitable for all investors, so please ensure that you fully understand the risks involved and seek independent advice if necessary. A Product Disclosure Statement (PDS) should be considered before entering into a transaction with us.

    The contents of this page are general information only and does not take into account your personal situation, financial objectives or needs. It is up to you to make sure the products that we offer suit your specific needs. You should not trade with us unless you understand the features and risks of the products that we offer. This means that you might need to seek independent advice before you start trading with us.

    © 2022 Raw Trading Ltd | All rights reserved.
    • Sample Page